How We Do It

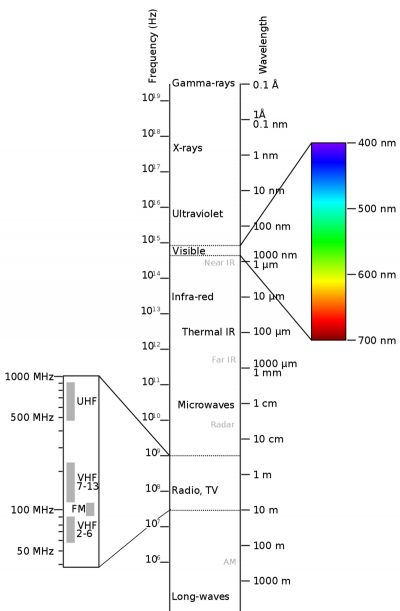
It all begins with the basic understanding of the electromagnetic spectrum (left). Only a very small portion of the spectrum is light visible to the human eye. It is that small slice of the spectrum – including the invisible ultraviolet and infrared bands on either end – which multispectral and hyperspectral sensors detect or, in simpler terms, “can photograph”.
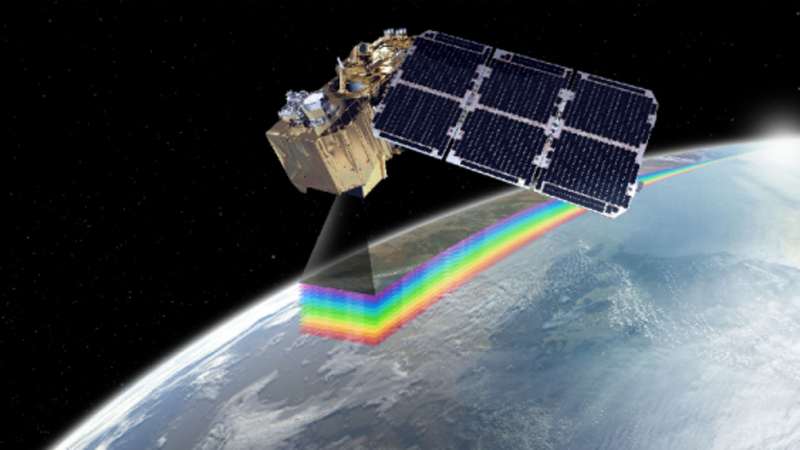
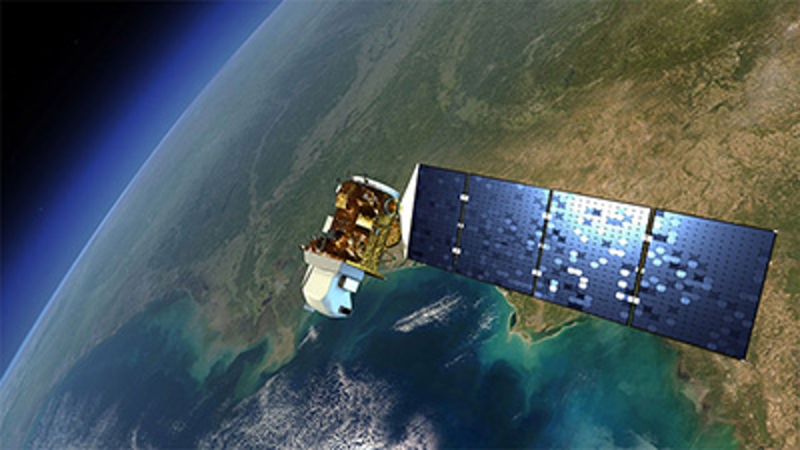
Puritas uses raw data collected by multispectral sensors mounted on two different satellite constellations: The European Space Agency’s Sentinel constellation, and the U.S.‘ Landsat constellation. (below)

ESA’s Sentinel 2A

USGS’ Landsat 8
The sensors mounted aboard these spacecraft do not “photograph” all of the bands of light, but only miniscule (measured in nanometers) slivers of certain bands of light. It’s akin to a person who’s color-blind. Their retinas are sensitive only to certain bands of light.
But this color-blindness on the multi- and hyperspectral sensors is by design, providing researchers with only the precise and most robust data needed to make their chosen scientific determinations.
The raw data provided by the sensors is of little use in and of itself. To the naked eye, the data appears like a photograph in dark grayscales. The value is in the hidden data which can only be revealed and expressed as the data is applied to specialized algorithms.
If it’s that simple, why isn’t everybody doing it?

Because it’s not that simple.
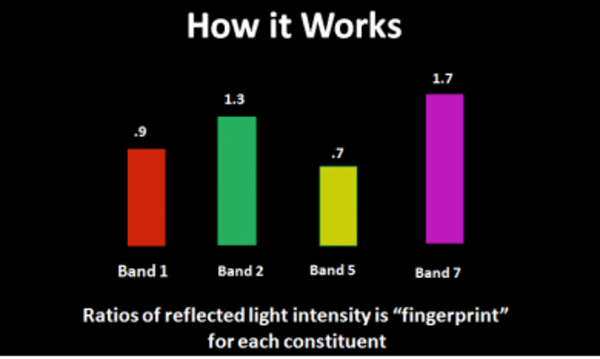
In order to produce an algorithm that provides accurate returns under all circumstances (i.e. variable sunlight, turbidity or other suspended solids in water environments, crop residue in farm fields), the algorithm must not be based only on the reflective values of a given set of bands of light, but the ratios between those bands.
It is the ratios between those bands – indicating how much of each band of light is being absorbed and how much is being reflected – that reveal what a certain substance is, and in what concentrations.
In short, that is the method by which Puritas Remote Sensing is identifying the “spectral fingerprint” of the target constituent or condition, using data from both the USGS’ Landsat and European Space Agency’s Sentinel constellation, and in the near future, from sensors mounted on drones for the most spatially precise determinations.
We at Puritas are tirelessly working every day on new capabilities to bring more value to the environmental and agricultural markets.
And we welcome your suggestions regarding types of data we should target in our research. If you’ve got a gap in your data, we’ll work to fill it.
Stay tuned.
